Multiplication Chart Method: A Beginner's Step-by-Step Guide
Unlock Multiplication: Learn How to Use a Multiplication Chart Easily
The multiplication chart, also known as a times table chart, is a fantastic visual tool for anyone diving into the world of multiplication basics. But if you're new to it, you might be wondering, "What is the multiplication chart method?" or "How do you read a times table grid?" Don't worry! This guide is here to break down the multiplication chart method into simple, easy-to-follow steps. Soon, you'll be reading a multiplication chart like a pro and understanding this essential math reference tool. Ready to explore useful math tools?
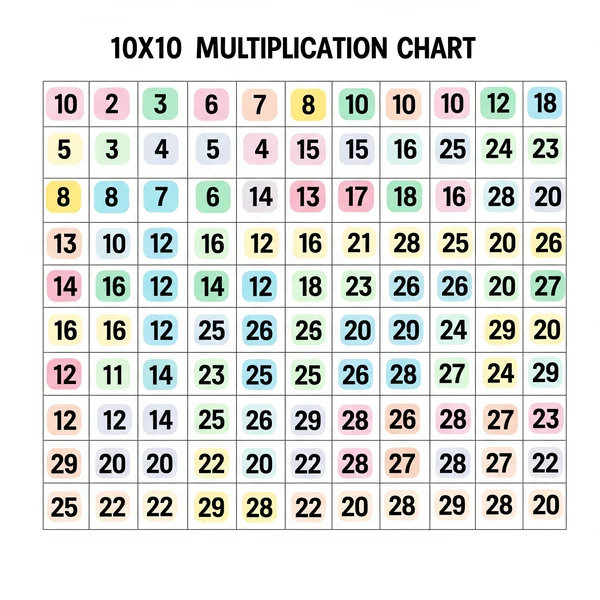
What is a Multiplication Chart? Understanding the Grid
Before we learn how to use a multiplication chart, let's understand what it is. It’s a fundamental tool for elementary multiplication.
The Rows: Your First Factor
A multiplication chart is typically a square grid. Along the first column (usually on the left side), you'll see a list of numbers (e.g., 1 through 10, or 1 through 12). These numbers represent one of the numbers you want to multiply (a factor).
The Columns: Your Second Factor
Similarly, across the top row of the multiplication grid, you'll find another list of numbers. These represent the second number you want to multiply (the other factor).
The Cells: Where Products Are Found
The main body of the chart is filled with cells. Each cell is at the intersection of a specific row and a specific column. The number inside each cell is the product (the answer) of multiplying the number from that row by the number from that column. This number grid explanation is key to its use.
The Core "Multiplication Chart Method": Finding Products
The beauty of the multiplication chart method lies in its simplicity for finding products. Here's how it works:
Example 1: Finding 3 x 4 on the Chart
- Find the number '3' in the first column (or top row).
- Find the number '4' in the top row (or first column).
- Carefully follow the row starting with '3' across, and the column starting with '4' down, until they meet.
- The number in the cell where they intersect is '12'. So, 3 x 4 = 12!
Example 2: How to Find 7 x 8
- Locate '7' (your first factor) – let's say in the first column.
- Locate '8' (your second factor) – in the top row.
- Trace your finger (or eyes) along the row from '7' and down the column from '8'.
- They will meet at the cell containing '56'. Thus, 7 x 8 = 56. This systematic approach is the heart of understanding times tables visually.
Practice: Try Finding Other Products
Grab a multiplication chart (you can find great printable chart benefits and options here) and try finding a few more products yourself, like 5 x 9, or 2 x 6. The more you practice, the quicker you'll become.
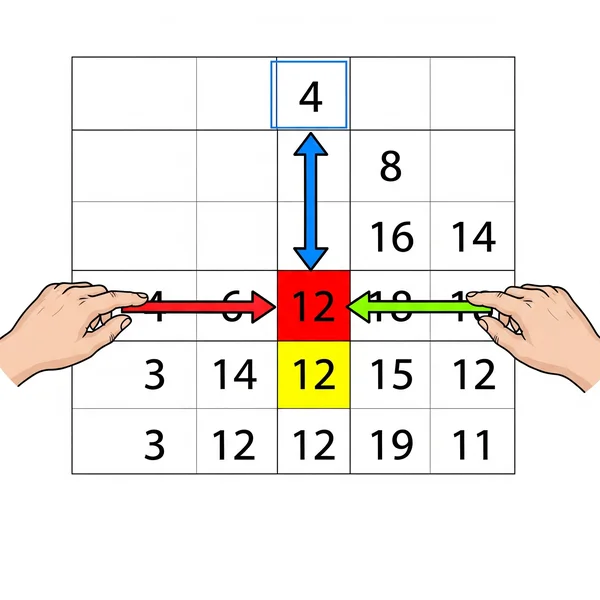
How to Read a Multiplication Chart Like a Pro
How to explain multiplication chart to a child? Break it down into these simple steps for reading a multiplication chart:
Step 1: Pick Your First Number
Choose the first number (factor) you want to multiply. Find it either in the first column (down the left side) of the times table chart.
Step 2: Pick Your Second Number
Choose the second number (factor) you want to multiply. Find this number in the top row (across the top) of the chart.
Step 3: Trace to the Meeting Point
Imagine drawing a straight line from your first number across its row, and another straight line from your second number down its column. The point where these two imaginary lines cross is what you're looking for. This step-by-step math approach makes it easy.
Step 4: Read the Answer (The Product!)
The number in the cell where your row and column meet is the product – the answer to your multiplication problem! This is the easiest way to use a multiplication chart.
Beyond Basic Products: What Else Can You Learn from the Chart?
A multiplication chart is more than just an answer-finder; it’s a rich visual math tool.
Spotting Square Numbers (The Diagonal Line)
Look at the numbers along the diagonal line from the top-left corner to the bottom-right. These are square numbers (1x1=1, 2x2=4, 3x3=9, etc.).
Understanding the Commutative Property (e.g., 2x5 = 5x2)
The chart visually demonstrates that the order of multiplication doesn't change the product. For example, find 2x5 (which is 10) and then find 5x2 (also 10). You'll see they are the same, reinforcing a key concept in multiplication basics.
Visualizing Skip Counting Patterns
Each row and column essentially shows skip counting. The row for '3' shows skip counting by 3s (3, 6, 9, 12...). This helps with understanding times tables more deeply.
Tips for Using a Multiplication Chart Effectively with Kids
When teaching kids multiplication using a chart:
Start Simple: Focus on Smaller Numbers First
Begin with the 1s, 2s, 5s, and 10s tables, which often have easier patterns to spot on the multiplication grid. This builds confidence.
Make it Interactive: Use Pointers or Markers
Have children use their fingers, a pencil (lightly!), or small counters to trace the rows and columns. This makes the process more tactile and engaging.
Connect to Real Objects and Groups
Relate the chart back to physical groups. If they find 3x4=12 on the chart, show them 3 groups of 4 blocks to make the connection concrete.
Encourage Independent Exploration of the Times Table Chart Guide
Once they understand the basics, let them explore the times table chart guide on their own. They might discover patterns or facts you haven't pointed out yet!
Mastering the Multiplication Chart Method is Easy!
The multiplication chart method is a straightforward and highly effective way for beginners to learn multiplication and understand how products are derived. It demystifies the multiplication table and turns it into a helpful math reference tool. With a bit of practice using this step-by-step math approach, anyone can master reading a multiplication chart. Remember, consistent use will help these facts transition from the chart to memory!
Your Multiplication Chart Method Questions Answered
Is there only one "multiplication chart method"?
The core method described (finding the intersection of a row and column) is the standard and most direct way to use a multiplication chart to find products. While people might have variations in how they explain it, the fundamental principle is the same.
At what age should kids start learning how to use a multiplication chart?
At what age to use multiplication chart? Typically, children start learning multiplication concepts and how to use a chart around 2nd or 3rd grade (ages 7-9), once they have a good grasp of addition and skip counting.
Can a multiplication chart help with division too?
Multiplication chart for division? Yes, absolutely! If you know the product and one factor, you can use the chart to find the other factor (which is division). For example, to find 24 ÷ 4, find '4' in the first column, then look across that row until you find '24'. The number at the top of that column ('6') is your answer.
Where can I find a good, clear multiplication chart to practice with?
You can often find them in textbooks or educational workbooks. Many websites also offer free printable versions. For a variety of clear and easy-to-use options, you can explore our multiplication chart resources.