Master the Multiplication Chart Visually: Uncover Patterns with an Interactive Table
Tired of the endless drills and rote memorization that come with learning multiplication? What if there was a secret code hidden within the numbers—a series of patterns that could turn this daunting task into a fun and exciting visual quest? The great news is, there is! Understanding multiplication patterns is the key to unlocking true math fluency, making learning faster, easier, and far more engaging. How can understanding patterns make learning multiplication easier? It transforms learning from a memory game into a logic puzzle, empowering students to see connections instead of just memorizing facts.
This guide will walk you through the amazing patterns hiding in plain sight on the multiplication chart. We'll show you how to spot them and how a powerful visual tool can make them come alive. Ready to change the way you see math? You can explore our chart right now to follow along.
Understanding Foundational Math Patterns
Before we dive into the multiplication table itself, it's crucial to grasp the two simple concepts that multiplication is built upon. Seeing how these foundational math patterns work makes the entire grid make sense. Think of it as learning the alphabet before you start reading words; it's the essential first step toward mastery.
The Role of Skip Counting in Multiplication
At its heart, a multiplication table is just a big, organized list of skip counting. When you recite the 3s times table (3, 6, 9, 12…), you are simply skip counting by three. Each row and column on a multiplication chart represents a skip-counting sequence. For example, the row for the number 4 is 4, 8, 12, 16, and so on.
Recognizing this helps demystify the chart. Instead of seeing over a hundred random numbers, you can see ten distinct, predictable sequences. This simple shift in perspective makes the chart less intimidating and more approachable for young learners. It builds on a skill they likely already have, making multiplication feel like a natural next step.
Repeated Addition: Multiplication's Simpler Form
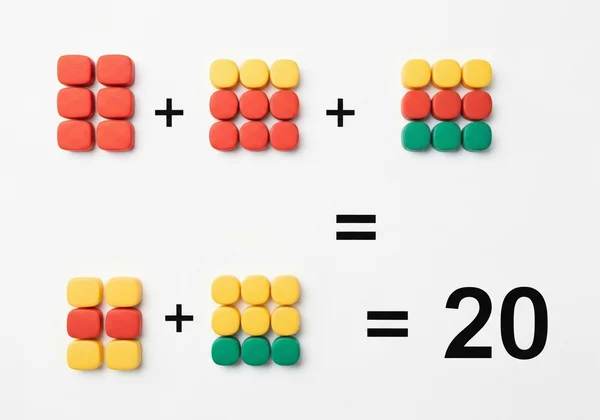
The other core principle behind multiplication is repeated addition. The equation 5 x 4 is just a shortcut for saying "add the number 4 five times" (4 + 4 + 4 + 4 + 4). This concept is fundamental because it explains why multiplication works the way it does. It connects the abstract idea of "times" to the concrete action of adding.
When looking at a times table chart, you can see repeated addition in action. Moving one step to the right along any row is the same as adding that row's number one more time. Understanding this helps students self-correct. If they forget 6 x 7 but know 6 x 6 is 36, they can simply add 6 to find the answer.
Key Multiplication Patterns to Look For in Your Chart
Now that the foundation is set, let’s uncover the shortcuts and secrets hidden within the grid. These are the key multiplication patterns that will supercharge learning and boost confidence. Once you see them, you can't unsee them!
The Commutative Property: Flipping Numbers (e.g., 3x5 = 5x3)
This is perhaps the most powerful trick of all. The commutative property of multiplication simply means that you can swap the numbers being multiplied and still get the same answer. For example, 3 x 5 equals 15, and so does 5 x 3.
What does this mean for learning? It instantly cuts the number of facts you need to memorize in half! If you know the entire 3s table, you already know a large chunk of every other table. On a multiplication chart, this property creates perfect symmetry. The number in the square where row 3 and column 5 meet is the same as the one where row 5 and column 3 meet.
Identifying Square Numbers with Visual Cues
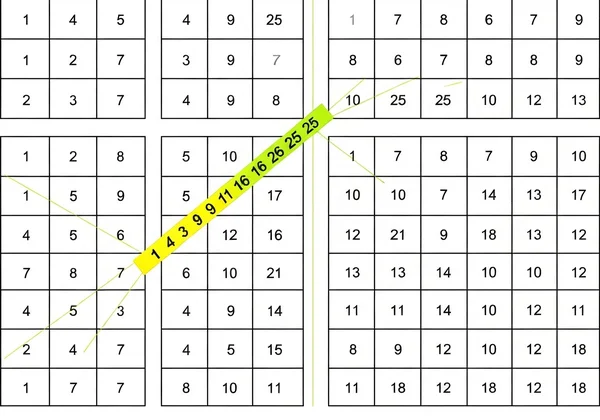
Have you ever noticed the clean diagonal line of numbers running from the top-left to the bottom-right of a multiplication chart? These are the square numbers (1x1=1, 2x2=4, 3x3=9, 4x4=16, etc.). They are the result of multiplying a number by itself.
These numbers act as a powerful visual landmark on the grid. They separate the two symmetrical halves of the chart created by the commutative property. Highlighting these numbers can make the grid's structure even clearer. This is where an interactive multiplication table truly shines, as you can color this diagonal line to make it pop.
Easy Patterns: Mastering the 0s, 1s, 5s, and 10s Tables
Some times tables are so easy they feel like freebies. Mastering them first is a fantastic way to build momentum and confidence.
- The 0s Table: Anything multiplied by zero is always zero. This entire row and column are just zeros. Easy!
- The 1s Table: Any number multiplied by one is that number itself. The 1s row and column are just a countdown from 1 to 12.
- The 5s Table: All answers in the 5s table end in either a 5 or a 0. It’s a simple alternating pattern that’s easy to remember.
- The 10s Table: This might be the easiest of all. Just add a zero to the end of the number you are multiplying by 10. For example, 10 x 7 is 70.
By mastering these four tables, a student already knows a significant portion of the entire chart.
Diagonal Symmetry and Repeating Sequences
Beyond the main diagonal of square numbers, the chart is filled with other fascinating visual patterns. The entire chart is a mirror image of itself across that diagonal, thanks to the commutative property we discussed earlier. This visual multiplication grid makes it easy to see that 7 x 8 is the same as 8 x 7.
Other patterns emerge within specific tables. For instance, in the 9s table, the digits of the answer always add up to 9 (e.g., 9 x 2 = 18, and 1+8=9; 9 x 7 = 63, and 6+3=9). Furthermore, as you go down the 9s column, the tens digit goes up by one, and the ones digit goes down by one. Spotting these little tricks makes learning fun.
Leveraging Interactive Charts for Pattern Discovery
Reading about patterns is one thing, but seeing and interacting with them is what truly cements the knowledge. This is where modern online multiplication tools transform the learning experience from passive to active, turning students into mathematical detectives.
How Our Interactive Chart Makes Patterns Pop with Color
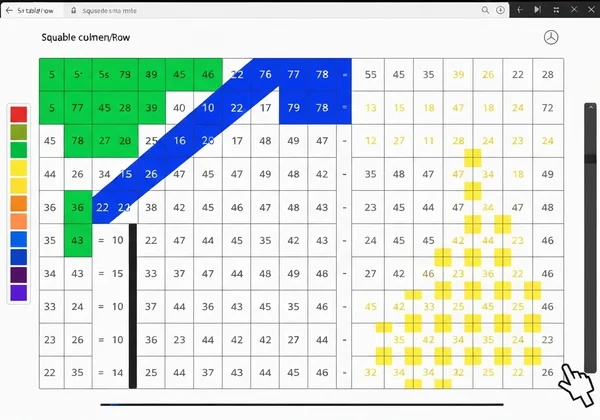
Static black-and-white charts are a thing of the past. The core feature of our online multiplication chart is its interactive color palette. Imagine you want to see all the square numbers. You can simply select a color and click on 1, 4, 9, 16, and so on. Instantly, the diagonal line appears in bright, bold color, making the pattern impossible to miss.
Want to explore the 5s table? Color all the numbers ending in 5 or 0. Curious about even and odd numbers? Use two different colors to mark them and watch the checkerboard pattern emerge. This ability to visually isolate and highlight numbers makes our tool an incredibly effective way to discover and understand these hidden relationships.
Dynamic Exploration: More Than Just a Static Grid
Our tool is more than just a colorful grid. It’s a dynamic learning environment. When you hover your mouse over any number in the chart, the corresponding row and column are instantly highlighted, and the full multiplication fact (e.g., "6 x 8 = 48") appears. This provides immediate feedback and reinforces the connection between the factors and the product.
This interactive element keeps learners engaged. It encourages exploration and experimentation in a way a static sheet of paper never could. It’s one of the best free math resources available for turning practice into play.
Combining Online Fun with Printable Practice
We know that a balanced learning approach is key. While interactive online tools are fantastic for discovery and engagement, traditional practice is still essential for reinforcement. That's why we bridge the gap between digital and physical learning.
After exploring patterns on our interactive chart, you can download a variety of printable versions. We offer everything from a fully filled-out free multiplication chart to a blank multiplication chart for practice quizzes. You can even color-code patterns online and then print your custom chart for offline study. This hybrid approach gives you the best of both worlds.
Unlock Your Math Potential: Patterns Make Perfect
Mastering the multiplication table doesn't have to be a chore. By shifting your focus from memorization to pattern recognition, you can unlock a deeper, more intuitive understanding of how numbers work together. From the simple symmetry of the commutative property to the satisfying sequences in the 9s table, the multiplication chart is a treasure map of mathematical secrets.
The key is to make these patterns visible, and that’s where our tools can help. An interactive, color-coded chart brings these concepts to life, empowering students, parents, and teachers to explore math in a fun, engaging, and highly effective way.
Ready to stop memorizing and start understanding? Start exploring today and see the beautiful patterns of multiplication for yourself!
Frequently Asked Questions About Multiplication Patterns
What is a multiplication chart and how does it show patterns?
A multiplication chart, or times table grid, is a table that shows the products of two numbers. It typically displays numbers 1 through 12 along the top row and left column. The numbers inside the grid are the answers to multiplying the corresponding row and column numbers. It reveals patterns through symmetry, sequences (like skip counting), and visual groupings, such as the diagonal line of square numbers.
How can understanding patterns make learning multiplication easier?
Understanding patterns reduces the cognitive load of memorization. Instead of having to remember over 100 separate facts, you can learn a handful of rules and patterns that apply across the entire chart. For example, knowing the commutative property (3x7 = 7x3) immediately cuts the number of facts to learn in half. Patterns make multiplication predictable and logical rather than random and arbitrary.
What are the easiest ways to start finding patterns in times tables?
The best way to start is by exploring the "easy" tables: the 0s, 1s, 5s, and 10s. Their patterns are very simple and build confidence. After that, look for the diagonal line of square numbers. From there, you can explore the symmetry on either side of that line. Using a tool like our interactive chart with color highlighting makes this process simple and fun.
How does our interactive chart help visual learners explore patterns?
Our platform is designed specifically for visual learners. Its key features include an interactive color palette that allows users to highlight specific numbers or patterns, making them stand out visually. The hover feature instantly shows the relationship between rows, columns, and answers. This transforms the static grid into a dynamic canvas for mathematical discovery, allowing students to see, touch, and interact with the patterns they are learning.