Interactive Multiplication Chart: Unlocking Number Patterns
Struggling to help your child truly understand multiplication, not just memorize it? Many parents and teachers find that traditional rote learning falls short, especially when it comes to seeing the bigger picture of times tables. But what if learning multiplication could be an engaging adventure, turning complex numbers into visible, fun patterns? Discover how a dynamic interactive multiplication chart can transform this process. Here, we'll explore how visual learning makes abstract math concepts simple and intuitive, guiding students, parents, and teachers toward multiplication mastery. Get ready to effortlessly explore number relationships and see math in a whole new light. start learning multiplication
What Are Multiplication Patterns & Why Visual Learning Helps?
Traditional rote memorization of multiplication facts can feel like a daunting task for many learners. It's often disconnected, making it hard to see the underlying logic. However, mathematics is full of beautiful multiplication patterns that, once discovered, can make understanding and recalling facts much easier. These patterns are the hidden keys to unlocking a deeper comprehension of numbers.
Beyond Rote: The Power of Seeing Math Concepts
Imagine trying to understand a complex dance routine by just reading instructions. It’s hard, right? But if you watch someone perform it, it becomes much clearer. The same applies to math. Seeing math concepts visually allows our brains to process information differently. It moves beyond abstract symbols on a page to concrete relationships. Visual aids transform multiplication from a list of facts into an observable system, fostering genuine mathematical intuition and making learning multiplication more accessible and enjoyable for everyone. This approach builds a strong foundation for future mathematical challenges.
Introducing Our Interactive Multiplication Chart Tool
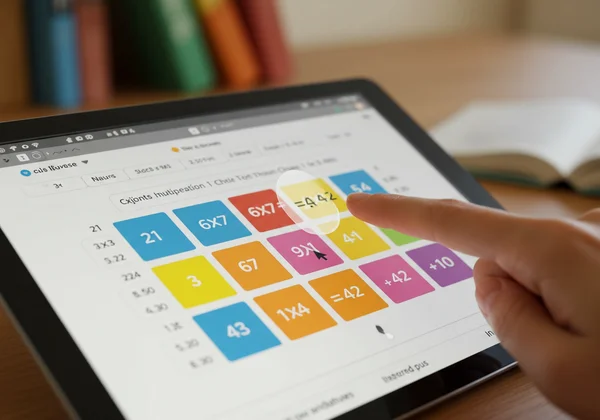
This is where our interactive tool makes a real difference! Our interactive multiplication chart tool provides a completely free and highly intuitive way to bring these patterns to life. Instead of static numbers, you'll find a dynamic multiplication grid where every interaction provides immediate feedback. Users can simply hover over any cell to see the full multiplication equation and result displayed instantly. This interactive experience significantly enhances retention and makes exploring the multiplication table an engaging activity. Experience the difference yourself; explore the chart on our homepage now!
Step-by-Step Guide: Using the Color Highlight Feature
One of the most powerful features of our platform is its color highlight multiplication function. This tool allows you to actively explore the multiplication patterns we discussed earlier, turning abstract concepts into vibrant visual discoveries.
Navigating Our Interactive Multiplication Grid
Getting started is incredibly easy. Simply visit our homepage, and you'll immediately see the interactive grid. The grid presents a standard multiplication chart 1-12 (or 1-100, depending on your view). When you move your mouse over any number in the grid, the corresponding row and column highlight, and the full equation (e.g., 6 × 7 = 42) appears below the chart. This instant feedback helps reinforce each individual multiplication fact. The interface is designed to be clean, intuitive, and distraction-free, ensuring a smooth visual learning experience for all ages.
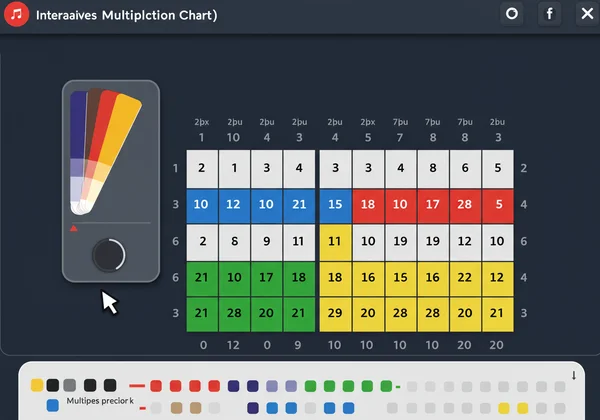
Choosing & Applying Colors to Reveal Hidden Patterns
The magic truly begins with the color palette located on the left side of the chart. Here’s how to use it:
-
Select a Color: Pick any color from the palette that catches your eye.
-
Click a Cell: Click on any cell within the multiplication chart. The cell will instantly be filled with your chosen color.
-
Discover Patterns: Now, here’s the fun part! Try coloring all the multiples of a specific number (like all the multiples of 2, 3, or 5). Or try coloring all the square numbers. As you fill in the cells, distinct number patterns will emerge. This visual representation helps solidify understanding in a way that mere memorization cannot. It’s like painting with numbers! This unique feature makes our platform one of the most effective online multiplication tools available.
Unveiling Common Times Table Patterns
Using the color highlight feature, you can easily spot fascinating times table patterns that make memorization feel natural and logical. Let’s look at some examples you can discover right away on our site.
The Dance of Even and Odd Products on the Chart
With our color highlight feature, you can quickly identify the even and odd products within the multiplication chart. Try coloring all even numbers one color and all odd numbers another. What do you notice? You'll see distinct patterns emerge based on the multiplication of even and odd numbers:
- Even × Even = Even
- Even × Odd = Even
- Odd × Odd = Odd This visual distinction helps children understand fundamental number properties in a concrete way, moving beyond simple memorization to true comprehension.
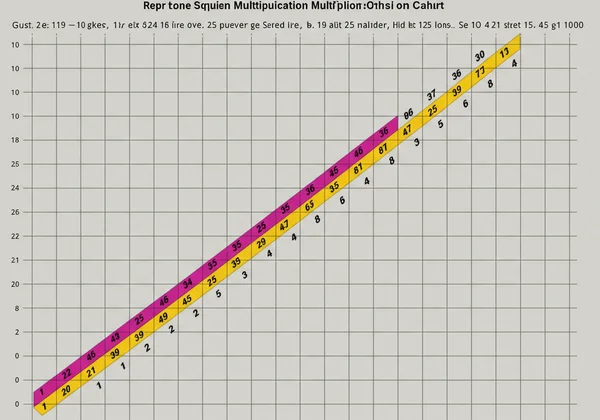
Spotting Square Numbers & Their Visual Symmetry
Square numbers (1, 4, 9, 16, 25, etc.) are the result of a number multiplied by itself (e.g., 3 × 3 = 9). On a multiplication chart, these numbers form a striking diagonal line from the top-left corner to the bottom-right. Use the color highlight feature to mark all the square numbers. You’ll instantly see this beautiful visual symmetry, making them easy to identify and remember. This visual cue reinforces their unique nature within the multiplication sequence.
Mastering the Tricky 9s Table with Interactive Cues
The 9s table often poses a challenge for young learners, but it's packed with incredible patterns! Use our interactive tool and the color feature to explore it:
- The "Sum to 9" Rule: For any multiple of 9 (up to 9x10=90), the digits of the product always add up to 9 (e.g., 9 × 3 = 27; 2 + 7 = 9).
- The "Finger Trick": Though not directly on the chart, it's a great complementary trick.
- The "Tens Digit Increasing, Ones Digit Decreasing": As you move down the 9s column/row, the tens digit increases by one, and the ones digit decreases by one (e.g., 9, 18, 27, 36...). Coloring the 9s row/column on our interactive chart will visually emphasize these relationships, making the "tricky 9s" much simpler to grasp. This makes learning less about rote and more about discovery.
Maximizing Your Visual Learning Journey for Multiplication Mastery
Our free multiplication chart tool is just the beginning of your journey to multiplication mastery. To get the most out of your learning experience, consider these additional tips.
Experimenting and Discovering Your Own Number Insights
The best way to learn is by doing and discovering! Don't just follow pre-defined patterns; experiment. Try coloring specific rows or columns. Highlight all numbers ending in 0 or 5. What unique formations appear? The more you play and interact with the multiplication grid, the more your brain will naturally form connections and truly understand the relationships between numbers. This active engagement is key to deep learning and makes the process of learning multiplication far more effective and memorable. Dive in and discover patterns for yourself!
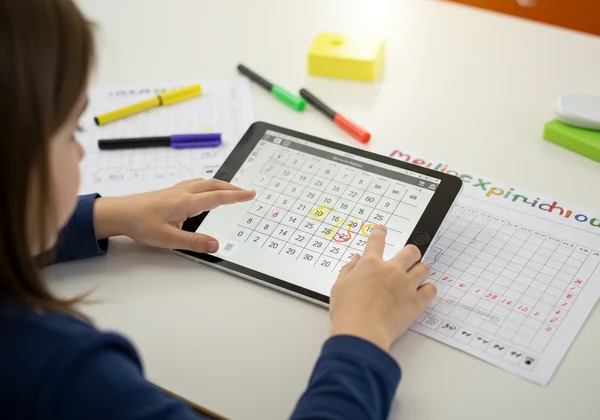
Combining Interactive & Printable Charts for Best Results
While our interactive multiplication table offers dynamic learning, sometimes a tangible resource is invaluable. MultiplicationChart also provides printable multiplication chart versions, including blank multiplication chart options for practice. You can download and print these charts for offline use, homework, or classroom activities. This combination of online interaction and offline practice ensures a comprehensive learning experience, catering to different learning styles and environments. It’s the perfect blend for reinforcing math facts table skills wherever you are. To access these useful resources, simply download free charts from our site.
Transform Your Math Skills with Interactive Charts!
Mastering multiplication doesn't have to be a struggle. With the right tools, it can be an exciting journey of discovery. Our interactive multiplication chart is designed to make learning multiplication engaging, intuitive, and effective. By transforming abstract numbers into vibrant, visible multiplication patterns, we empower students to build a strong foundation in math with confidence and joy. Whether you're a student looking to conquer your times tables, a parent seeking effective teaching aids, or a teacher wanting to make math come alive in the classroom, our free tool is here to help. We invite you to unlock the power of visual learning today. Try our free tool and start your journey to multiplication mastery!
Frequently Asked Questions About Interactive Multiplication Charts
What is a multiplication chart and how does it work?
A multiplication chart, also known as a times table chart or multiplication grid, is a mathematical tool that displays the results of multiplication operations in a grid format. Our interactive multiplication chart takes this concept further by allowing you to hover over cells to see equations and click to color-highlight cells, making it a dynamic online multiplication tool for exploring number relationships.
How can I use an interactive multiplication chart effectively for learning?
To use an interactive multiplication chart effectively for learning, focus on discovering patterns rather than just memorizing. Utilize the color-highlighting feature on our interactive chart to mark multiples, square numbers, or even/odd products. Regularly interact with the chart, challenging yourself to predict outcomes before hovering, and combine it with our printable multiplication chart resources for offline practice.
Are there any fun ways to learn multiplication facts?
Absolutely! Besides traditional methods, fun multiplication games and interactive tools are excellent. Our platform provides a highly visual and engaging platform that transforms learning into an exploratory activity. Our color-highlighting feature lets you "paint" and discover multiplication patterns, making it an enjoyable and effective way to internalize math facts.
Why is visual math learning important for kids?
Visual math learning is important for kids because it caters to different learning styles and helps translate abstract numbers into concrete, understandable concepts. When children can see multiplication patterns and relationships, it builds a deeper understanding, makes information more memorable, and reduces the frustration often associated with rote memorization. It transforms complex ideas into intuitive insights.
Can I print charts from MultiplicationChart.cc?
Yes! In addition to our interactive online tool, MultiplicationChart provides options to download and print free multiplication chart versions. This includes both filled and blank multiplication chart PDFs, which are perfect for homework, classroom use, or simply practicing offline without a screen. Just visit our homepage and look for the download options to get your printable multiplication chart.