Interactive Multiplication Chart: Parent & Teacher Walkthrough
Struggling to make multiplication engaging for your child or students? You're not alone. Many educators and parents find traditional memorization methods ineffective. Our interactive multiplication chart, a dynamic interactive multiplication table, transforms learning from a chore to an adventure. In this definitive guide, you'll discover how to maximize this free tool's potential—whether teaching at home or in a classroom setting.
Getting Started with the Interactive Multiplication Chart
Navigating the Basic Interface
The moment you visit our multiplication chart, you'll see a colorful grid from 1x1 to 12x12. The clean design ensures immediate usability—no tutorials needed. Notice the left-side toolbar with these key features:
- Table size selectors (10x10, 12x12, or extended grids)
- Color palette for pattern highlighting
- PDF download button for printable versions
- Language dropdown with 20+ translation options
Everything loads instantly—no ads, no login walls.
Understanding the Hover and Click Functions
Instant feedback is what makes our tool revolutionary. Hover over 7x8? Watch as row 7 and column 8 highlight in teal while "7 x 8 = 56" displays prominently. Click any cell to lock the highlight—perfect for comparing multiple equations side-by-side. This visual reinforcement helps learners grasp concepts like:
-
Commutative property (show how 4x7 and 7x4 equal 28)
-
Square numbers (diagonal cells in yellow)
-
Common trouble spots (use red to mark 6x8 vs 7x8)

Customizing the Chart for Different Learning Needs
Not all students learn alike. With our tool, you can:
- Simplify grids: Start with 5x5 tables for beginners
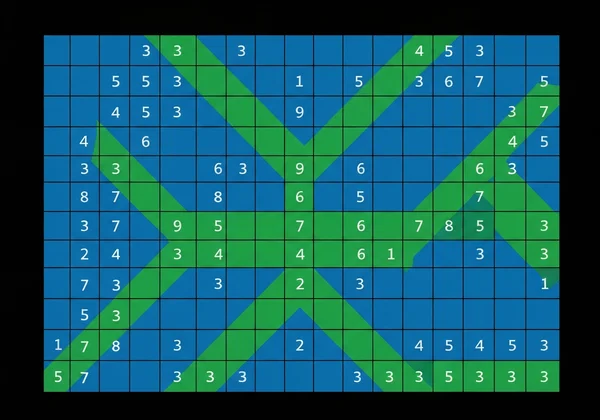
- Create visual pathways: Color-code multiples of 3 in blue, multiples of 4 in green
- Build confidence: Hide answers initially, then reveal them progressively
Try this with your students: A teacher, Mrs. Alvarez, uses a "rainbow sequence"—students color multiples in spectral order. The beautiful pattern helps them see math as an art form.
Advanced Color Highlighting Techniques
Identifying Patterns with Color Coding
Visual learning boosts retention by 400% according to educational research. Use our tool to reveal:
- Even/Odd Patterns: Highlight all even products in blue
- Times Table Sequences: Isolate the 9s table with purple
- Prime Number Clusters: Mark primes (blue for 2x2, red for 3x3)
Pro Tip: Have students predict colors before applying them—"What do you think happens when we mark multiples of 5?"
Creating Custom Learning Pathways for Students
Structured color activities accelerate mastery:
- Beginner: Color only the 2s table
- Intermediate: Alternate colors for odd/even products
- Advanced: Overlap colors to show least common multiples
Parent Testimonial: "My daughter progressed from hating math to loving it once she recognized the repeating color patterns."
Tracking Progress with Color Markers
Teachers can assign color-coded achievement levels:
- Gold = Mastered (10 correct answers in a row)
- Silver = Progressing (7-9 correct)
- Bronze = Practicing (<6 correct)
Periodically reset the chart and compare colored areas. Imagine a student, Liam, who struggled with his 7s. By marking his correct answers in green each week, he could visually see the green area grow—a huge confidence booster.
Integrating Printable Charts into Your Teaching Routine
Downloading and Printing Effective Practice Materials
88% of teachers supplement digital tools with physical materials. Our library of printable multiplication chart PDFs includes:
- ✅ Completed charts (reference guides)
- ✅ Blank grids (practice drills)
- ✅ Specialty charts (100-square grids for advanced learners)
Click any download button for instant access—no email required.
Creating Custom Worksheets from the Online Chart
Turn digital lessons into hands-on activities:
- Project our interactive multiplication table
- Collaborate on color-coding decisions
- Print a customized blank chart
- Assign students to replicate the pattern
Homework Idea: One parent, Sarah, found that printing a blank chart and filling it out with her son before his weekly quiz made studying feel like a team effort instead of a test.
Using Blank Charts for Assessment and Practice
Blank grids serve multiple purposes:
- Timed Drills: "Complete row 8 in 30 seconds"
- Self-Assessment: Circle trouble facts (e.g., 7x6)
- Creative Learning: Draw illustrations connecting the factors
Download blank multiplication charts for no-prep assessment tools.
Leveraging Multilingual Features for Diverse Classrooms
Supporting ESL Students with Language Switching
One click changes all labels and instructions to Spanish, Arabic, Mandarin or 17 other languages. Teachers report:
"Maria finally understood 'times tables' when we switched to Spanish—her scores improved 60% in two weeks."
Implementation Tip: Display both languages side-by-side during bilingual lessons.
Creating Bilingual Learning Materials
Combine our PDF tool with language settings to generate dual-language worksheets:
- Set chart to Spanish
- Download PDF
- Print alongside English version
Students connect "3 x 4 = 12" with "tres por cuatro igual a doce," building math and language skills simultaneously.
Understanding Cultural Nuances in Math Education
Did you know?
- Chinese Learners: Often start with the 9x9 grid rather than 12x12
- European Formats: Sometimes use "·" instead of "x" (adjustable in settings)
- Color Symbolism: Avoid using red for errors in cultures where it signifies prosperity
Our tool's global accessibility options respect these differences.
Transform Your Math Instruction Today
You now have practical tools and strategies to turn multiplication anxiety into excitement. Our interactive multiplication chart bridges the gap between abstract concepts and tangible understanding through:
- Visual Pattern Discovery: Helping students "see" mathematics
- Flexible Implementation: Suitable for home kitchens or smart classrooms
- Cultural Adaptability: Making math accessible across languages
Don't let traditional methods hold back your learners. Explore our interactive multiplication charts now and watch those "aha!" moments multiply.
Frequently Asked Questions About Using Multiplication Charts
At what age should children start using multiplication charts?
Most educators introduce charts around age 7-8 (2nd/3rd grade). Start with small grids (1-5) focused on concrete examples—"If you have 3 baskets with 2 apples in each, how many apples are there in total?"
How often should students practice with multiplication charts?
Short daily sessions (5-10 minutes) outperform weekly marathons. Try our interactive tool during morning warm-ups or homework transitions.
Can multiplication charts replace memorization of times tables?
Charts supplement but don't replace recall. Use colors to build pattern recognition first, then phase out visual aids as fluency increases through our printable quiz sheets.
How do multiplication charts help with understanding multiplication concepts?
They demonstrate number relationships visually, helping students grasp:
- The commutative property (6x4 vs 4x6)
- Square numbers (diagonal patterns)
- Scaling effects (how quickly values grow)
Are there common mistakes teachers make when introducing multiplication charts?
Three frequent pitfalls:
- Rushing the process: Allow exploratory play first
- Ignoring patterns: Don't just drill random facts—highlight connections
- Neglecting games: Incorporate our interactive challenges for joyful learning